2. Predict Brown Dwarf Parameters Using Trained ML Models
In the following steps, you will:
We will need the following modules from TelescopeML:
DataMaster: to prepare the synthetic brown dwarf dataset, load the trained machine learning (ML) models.
Predictor: to prepare the observational brown dwarf dataset and deploy the trained ML models.
StatVisAnalyzer: provide statistical test and plotting functions.
IO_utils: provide functions to load the trained ML models.
[1]:
from TelescopeML.DataMaster import *
from TelescopeML.Predictor import *
from TelescopeML.StatVisAnalyzer import *
from TelescopeML.IO_utils import load_or_dump_trained_model_CNN
np.random.seed(seed=100)
No Bottleneck unit testing available.
2.1 Load the Brown Dwarf spectra and Trained CNNs models
2.1.1 Load the Synthetic spectra - training dataset
We computed a low-resolution spectrum (\(R\)=200) utilizing atmopshric brown dwarfs grid model, Sonora-Bobcat for spectral range $:nbsphinx-math:sim`$0.9-2.4 :math:mu m`. An open-source atmospheric radiative transfer Python package, PICASO was employed for generating these datasets. This dataset encompass 30,888 synthetic spectra (or instances or rows).
Each spectrum has 104 wavelengths (i.e., 0.897, 0.906, …, 2.512 μm) and 4 output atmospheric parameters: - gravity (log g) - temperature (Teff) - carbon-to-oxygen ratio (C/O) - metallicity ([M/H])
[2]:
import os

__reference_data_path__ = os.getenv("TelescopeML_reference_data")
__reference_data_path__


# Note: insert the directory of the reference_data if you get an error reading the reference data!!!
# __reference_data_path__ = 'INSERT_DIRECTORY_OF_reference_data'
[2]:
'/Users/egharibn/RESEARCH/ml/projects/TelescopeML_project/reference_data/'
Load the dataset and check few instances
[3]:
train_BD = pd.read_csv(os.path.join(__reference_data_path__,
                                    'training_datasets',
                                    'browndwarf_R100_v4_newWL_v3.csv.bz2'), compression='bz2')
train_BD
[3]:
| gravity | temperature | c_o_ratio | metallicity | 2.512 | 2.487 | 2.462 | 2.438 | 2.413 | 2.389 | ... | 0.981 | 0.971 | 0.962 | 0.952 | 0.943 | 0.933 | 0.924 | 0.915 | 0.906 | 0.897 | |
|---|---|---|---|---|---|---|---|---|---|---|---|---|---|---|---|---|---|---|---|---|---|
| 0 | 5.00 | 1100 | 0.25 | -1.0 | 9.103045e-08 | 1.181658e-07 | 1.307868e-07 | 1.269229e-07 | 1.159179e-07 | 8.925110e-08 | ... | 1.257751e-07 | 9.640859e-08 | 7.612550e-08 | 6.901364e-08 | 6.247359e-08 | 4.112384e-08 | 5.127995e-08 | 4.897355e-08 | 4.087795e-08 | 2.791689e-08 |
| 1 | 5.00 | 1100 | 0.25 | -0.7 | 9.103045e-08 | 1.181658e-07 | 1.307868e-07 | 1.269229e-07 | 1.159179e-07 | 8.925110e-08 | ... | 1.257751e-07 | 9.640859e-08 | 7.612550e-08 | 6.901364e-08 | 6.247359e-08 | 4.112384e-08 | 5.127995e-08 | 4.897355e-08 | 4.087795e-08 | 2.791689e-08 |
| 2 | 5.00 | 1100 | 0.25 | -0.5 | 9.103045e-08 | 1.181658e-07 | 1.307868e-07 | 1.269229e-07 | 1.159179e-07 | 8.925110e-08 | ... | 1.257751e-07 | 9.640859e-08 | 7.612550e-08 | 6.901364e-08 | 6.247359e-08 | 4.112384e-08 | 5.127995e-08 | 4.897355e-08 | 4.087795e-08 | 2.791689e-08 |
| 3 | 5.00 | 1100 | 0.25 | -0.3 | 9.103045e-08 | 1.181658e-07 | 1.307868e-07 | 1.269229e-07 | 1.159179e-07 | 8.925110e-08 | ... | 1.257751e-07 | 9.640859e-08 | 7.612550e-08 | 6.901364e-08 | 6.247359e-08 | 4.112384e-08 | 5.127995e-08 | 4.897355e-08 | 4.087795e-08 | 2.791689e-08 |
| 4 | 5.00 | 1100 | 0.25 | 0.0 | 9.103045e-08 | 1.181658e-07 | 1.307868e-07 | 1.269229e-07 | 1.159179e-07 | 8.925110e-08 | ... | 1.257751e-07 | 9.640859e-08 | 7.612550e-08 | 6.901364e-08 | 6.247359e-08 | 4.112384e-08 | 5.127995e-08 | 4.897355e-08 | 4.087795e-08 | 2.791689e-08 |
| ... | ... | ... | ... | ... | ... | ... | ... | ... | ... | ... | ... | ... | ... | ... | ... | ... | ... | ... | ... | ... | ... |
| 30883 | 3.25 | 1000 | 2.50 | 0.7 | 1.533414e-08 | 1.244438e-08 | 7.703017e-09 | 5.262130e-09 | 4.671165e-09 | 3.026652e-09 | ... | 2.064408e-08 | 1.919290e-08 | 1.685050e-08 | 1.772466e-08 | 1.726968e-08 | 1.341722e-08 | 1.365819e-08 | 8.811601e-09 | 4.752807e-09 | 2.206752e-09 |
| 30884 | 3.25 | 1000 | 2.50 | 1.0 | 6.942763e-09 | 5.536744e-09 | 3.501408e-09 | 2.445445e-09 | 2.168689e-09 | 1.477159e-09 | ... | 4.353813e-09 | 4.401064e-09 | 4.029425e-09 | 4.482797e-09 | 4.647158e-09 | 3.722947e-09 | 3.825720e-09 | 1.921753e-09 | 8.112957e-10 | 3.211086e-10 |
| 30885 | 3.25 | 1000 | 2.50 | 1.3 | 3.758895e-09 | 2.988295e-09 | 1.968653e-09 | 1.417744e-09 | 1.260679e-09 | 9.059680e-10 | ... | 1.546743e-09 | 1.698977e-09 | 1.577032e-09 | 1.813035e-09 | 1.915084e-09 | 1.497190e-09 | 1.512469e-09 | 5.734859e-10 | 1.823897e-10 | 6.218672e-11 |
| 30886 | 3.25 | 1000 | 2.50 | 1.7 | 3.150169e-09 | 2.503614e-09 | 1.672564e-09 | 1.218379e-09 | 1.085002e-09 | 7.942492e-10 | ... | 1.332727e-09 | 1.481450e-09 | 1.346700e-09 | 1.538485e-09 | 1.608156e-09 | 1.223594e-09 | 1.254078e-09 | 4.561500e-10 | 1.370389e-10 | 4.616465e-11 |
| 30887 | 3.25 | 1000 | 2.50 | 2.0 | 2.665630e-09 | 2.117952e-09 | 1.434730e-09 | 1.055994e-09 | 9.418247e-10 | 7.020869e-10 | ... | 1.533098e-09 | 1.647372e-09 | 1.385020e-09 | 1.517044e-09 | 1.524311e-09 | 1.096679e-09 | 1.209663e-09 | 4.837326e-10 | 1.534210e-10 | 5.612844e-11 |
30888 rows × 108 columns
2.1.2 Check atmospheric parameters
gravity (log g)
temperature (Teff)
carbon-to-oxygen ratio (C/O)
metallicity ([M/H])
[4]:
output_names = ['gravity', 'temperature', 'c_o_ratio', 'metallicity']
train_BD[output_names].head()
[4]:
| gravity | temperature | c_o_ratio | metallicity | |
|---|---|---|---|---|
| 0 | 5.0 | 1100 | 0.25 | -1.0 |
| 1 | 5.0 | 1100 | 0.25 | -0.7 |
| 2 | 5.0 | 1100 | 0.25 | -0.5 |
| 3 | 5.0 | 1100 | 0.25 | -0.3 |
| 4 | 5.0 | 1100 | 0.25 | 0.0 |
[5]:
wavelength_names = [item for item in train_BD.columns.to_list() if item not in output_names]
wavelength_names[:5]
[5]:
['2.512', '2.487', '2.462', '2.438', '2.413']
[6]:
wavelength_values = [float(item) for item in wavelength_names]
wavelength_values[:10]
[6]:
[2.512, 2.487, 2.462, 2.438, 2.413, 2.389, 2.366, 2.342, 2.319, 2.296]
[7]:
wl_synthetic = pd.read_csv(os.path.join(__reference_data_path__,
                                        'training_datasets',
                                        'wl.csv'))
wl_synthetic
[7]:
| wl | |
|---|---|
| 0 | 2.511960 |
| 1 | 2.486966 |
| 2 | 2.462220 |
| 3 | 2.437720 |
| 4 | 2.413464 |
| ... | ... |
| 99 | 0.933378 |
| 100 | 0.924091 |
| 101 | 0.914896 |
| 102 | 0.905792 |
| 103 | 0.896780 |
104 rows × 1 columns
2.1.3 Load the trained CNN model
Load the trained CNN model, which includes:
The model parameters to apply it to a given datasets
The training history to check the performance
[8]:
trained_CNN_model, trained_CNN_history = load_or_dump_trained_model_CNN(
                                                      output_indicator='tuned_bohb_batch32_v3_1000epoch_out10',
                                                      load_or_dump = 'load')
[9]:
trained_CNN_model.summary()
Model: "model_1"
__________________________________________________________________________________________________
 Layer (type)                Output Shape                 Param #   Connected to
==================================================================================================
 input_3 (InputLayer)        [(None, 104, 1)]             0         []

 Conv__B1_L1 (Conv1D)        (None, 104, 32)              160       ['input_3[0][0]']

 Conv__B1_L2 (Conv1D)        (None, 104, 128)             16512     ['Conv__B1_L1[0][0]']

 Conv__B1_L3 (Conv1D)        (None, 104, 288)             147744    ['Conv__B1_L2[0][0]']

 Conv__B1__MaxPooling1D (Ma  (None, 34, 288)              0         ['Conv__B1_L3[0][0]']
 xPooling1D)

 Conv__B2_L1 (Conv1D)        (None, 34, 128)              147584    ['Conv__B1__MaxPooling1D[0][0]
                                                                    ']

 Conv__B2_L2 (Conv1D)        (None, 34, 288)              147744    ['Conv__B2_L1[0][0]']

 Conv__B2_L3 (Conv1D)        (None, 34, 512)              590336    ['Conv__B2_L2[0][0]']

 Conv__B2__MaxPooling1D (Ma  (None, 11, 512)              0         ['Conv__B2_L3[0][0]']
 xPooling1D)

 flatten_1 (Flatten)         (None, 5632)                 0         ['Conv__B2__MaxPooling1D[0][0]
                                                                    ']

 FC1__B1_L1 (Dense)          (None, 256)                  1442048   ['flatten_1[0][0]']

 FC1__B1_L2 (Dense)          (None, 1024)                 263168    ['FC1__B1_L1[0][0]']

 FC1__B1_L3 (Dense)          (None, 2304)                 2361600   ['FC1__B1_L2[0][0]']

 FC1__B1_L3__Dropout (Dropo  (None, 2304)                 0         ['FC1__B1_L3[0][0]']
 ut)

 input_4 (InputLayer)        [(None, 2)]                  0         []

 Concatenated_Layer (Concat  (None, 2306)                 0         ['FC1__B1_L3__Dropout[0][0]',
 enate)                                                              'input_4[0][0]']

 FC2__B1_L1 (Dense)          (None, 128)                  295296    ['Concatenated_Layer[0][0]']

 FC2__B1_L2 (Dense)          (None, 512)                  66048     ['FC2__B1_L1[0][0]']

 FC2__B1_L3 (Dense)          (None, 1152)                 590976    ['FC2__B1_L2[0][0]']

 FC2__B1_L4 (Dense)          (None, 2048)                 2361344   ['FC2__B1_L3[0][0]']

 FC2__B1_L4__Dropout (Dropo  (None, 2048)                 0         ['FC2__B1_L4[0][0]']
 ut)

 output__gravity (Dense)     (None, 1)                    2049      ['FC2__B1_L4__Dropout[0][0]']

 output__c_o_ratio (Dense)   (None, 1)                    2049      ['FC2__B1_L4__Dropout[0][0]']

 output__metallicity (Dense  (None, 1)                    2049      ['FC2__B1_L4__Dropout[0][0]']
 )

 output__temperature (Dense  (None, 1)                    2049      ['FC2__B1_L4__Dropout[0][0]']
 )

==================================================================================================
Total params: 8438756 (32.19 MB)
Trainable params: 8438756 (32.19 MB)
Non-trainable params: 0 (0.00 Byte)
__________________________________________________________________________________________________
[10]:
# train_cnn_model.trained_model_history
plot_ML_model_loss_plt(trained_ML_model_history = trained_CNN_history,
                    title = 'Trained ML model',
                    __reference_data__=__reference_data_path__,
                    __save_plots__=True,)

2.1.4 Load the trained data prosessing Scalers
Load the trained StandardScalers which were trained and utilized to train the CNNs models:
trained_StandardScaler_X_ColWise_MinMax
trained_StandardScaler_y_ColWise
[11]:
Load_Save = LoadSave(trained_ML_model_name = 'CNN', ml_method = 'regression')

trained_StandardScaler_X_ColWise_MinMax = Load_Save.load_or_dump_trained_object(
                                                             trained_object = None,
                                                             output_indicator = 'Trained_StandardScaler_X_ColWise_MinMax',
                                                             load_or_dump='load'
                                                                            )

trained_StandardScaler_y_ColWise = Load_Save.load_or_dump_trained_object(
                                                             trained_object = None,
                                                             output_indicator = 'Trained_StandardScaler_y_ColWise',
                                                             load_or_dump='load'
                                                                            )
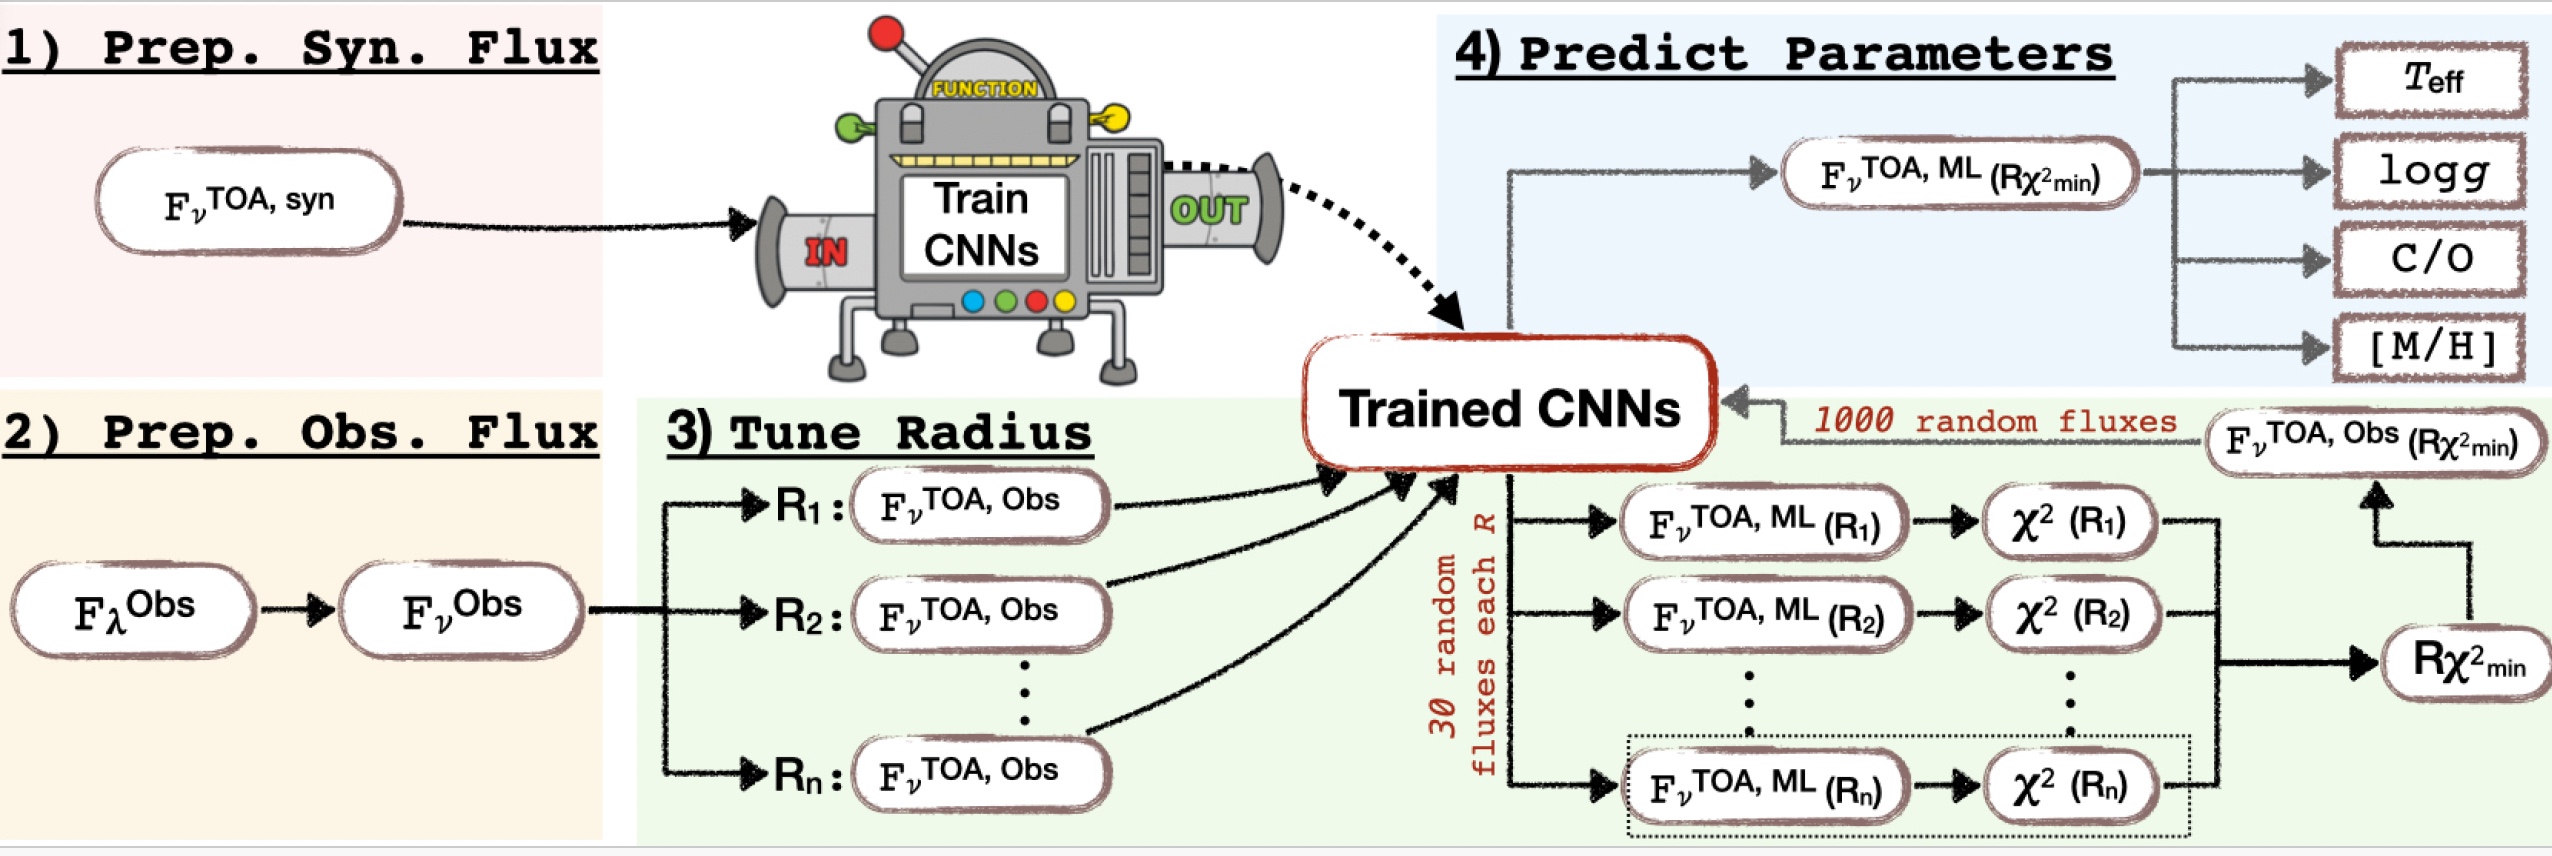
2.2 Predict Brown Dwarf Atmosphric Parameters of HD 3651 B Using the Tuned Radius
In the following, we will deploy the trained CNN models to predict atmospheric parameters. Major steps are:
Define the literature-reported data for the object.
Instantiate the ObsParameterPredictor class from the Predictor module.
Load the observational Telescope data:
Replace negative Flam values with zero.
Take the average of neighbors for Flam_error <= 0.
Plot the observational spectra with error bars.
Process the observational Telescope data:
Instantiate the ProcessObservationalDataset class.
Define
feature_names_syntheticandfeature_names_obs.
2.2.1 Tune the Radius Starting from the Literature Radius
These literature data were taken from Zhang et al. (2021) “Uniform Forward-modeling Analysis of Ultracool Dwarfs. I. Methodology and Benchmarking” link
[12]:
HD3651B_BD_literature_info = {
          'bd_name':'HD3651B',
          'bd_Teff':818,
          'bd_logg':3.94,
          'bd_met': -0.22,
          'bd_distance_pc' : 11.134,
          'bd_radius_Rjup' : .81,
          'bd_radius_Rjup_tuned': .81} #0.81
What is the 𝛘2 value (and p-value) for a range of \(R_{Jup}\) radius?
[13]:
def tune_radius(Rmin = HD3651B_BD_literature_info['bd_radius_Rjup']-0.2,
                Rmax = HD3651B_BD_literature_info['bd_radius_Rjup']+0.2,
                dR=0.05,
                Radius_list = None,
                brown_dwarf_literature_info = None,
                __plot_results__ = False,
               __print_results__ = False,
               __plot_stat_results__ = False):

    R_list = []
    chi_square_list = []
    p_value_list = []
    random_pred_mean_list = []


    for radius in Radius_list if Radius_list else list( np.linspace(Rmin, Rmax, num=int((Rmax-Rmin)/dR)+1 )):
        HD3651B_BD_literature_info['bd_radius_Rjup'] = radius

        # brown_dwarf_literature_info = Ross458C_BD_literature_info
        predict = ObserveParameterPredictor(object_name = HD3651B_BD_literature_info['bd_name'],
                                        training_dataset_df = train_BD,
                                        wl_synthetic = wl_synthetic,# wl_synthetic,
                                        bd_literature_dic = HD3651B_BD_literature_info,
                                        trained_ML_model=trained_CNN_model,
                                        trained_X_ColWise_MinMax=trained_StandardScaler_X_ColWise_MinMax,
                                        trained_y_ColWise=trained_StandardScaler_y_ColWise,
                                        trained_X_RowWise=None,
                                           )

        predict.load_observational_spectra(
            __plot_observational_spectra_errorbar__=False,
            __replace_zeros_negatives_with_mean__=True,
            __print_results__=False,
            )

        predict.Process_Observational_Dataset(
            __print_results__=False,
            F_lambda_obs=None,
            F_lambda_obs_err=None
                )

        predict.predict_from_random_spectra(random_spectra_num= 3,
                                             __print_results__= False,
                                             __plot_randomly_generated_spectra__= False,
                                             __plot_histogram__= False,
                                             __plot_boxplot_hist__= False,
                                             __plot_pred_vs_obs_errorbar__= False,
                                             __plot_pred_vs_obs_errorbar_stat_bokeh__ = False,
                                             __calculate_confidence_intervals_std_df__ = True,
                                            )


        chi_square, p_value =  chi_square_test(x_obs = predict.obs_data_df['wl'],
                                y_obs = predict.obs_data_df['Fnu_obs_TOA'],
                                yerr_obs = predict.obs_data_df['Fnu_obs_TOA_err'],

                                x_pre = predict.confidence_intervals_std_df['wl'].values[::-1],
                                y_pre = predict.confidence_intervals_std_df['mean'],
                                yerr_pre = predict.confidence_intervals_std_df['std_values'],
                                radius = HD3651B_BD_literature_info['bd_radius_Rjup'],
                                __plot_results__ = False,
                                __print_results__ = False)


        if chi_square:

            R_list.append(radius)
            chi_square_list.append(chi_square)
            p_value_list.append(np.float64(p_value))
            random_pred_mean_list.append(list( predict.dic_random_pred_mean.values() ))
        else:
            pass

        if __print_results__:
            print( f"Radius = {'{:.2f}'.format(radius)} R_Jup:  𝛘2 = {chi_square}")


    tuned_ML_R_param_df = pd.DataFrame(columns=['radius','chi_square','p_value','gravity','temperature','c_o_ratio','metallicity'])
    tuned_ML_R_param_df['radius'] = R_list
    tuned_ML_R_param_df['chi_square'] = chi_square_list
    tuned_ML_R_param_df['p_value'] = p_value_list
    tuned_ML_R_param_df['gravity'] = np.array(random_pred_mean_list).T[0]
    tuned_ML_R_param_df['c_o_ratio'] = np.array(random_pred_mean_list).T[1]
    tuned_ML_R_param_df['metallicity'] = np.array(random_pred_mean_list).T[2]
    tuned_ML_R_param_df['temperature'] = np.array(random_pred_mean_list).T[3]

    tuned_ML_R_param_df.to_csv(os.path.join(__reference_data_path__,'figures',
                                                     brown_dwarf_literature_info['bd_name']+
                                                     'tuned_ML_R_param_df.csv'),
                                                      index = False,
                                                      columns=list(tuned_ML_R_param_df.columns))

    if __print_results__:
        display( tuned_ML_R_param_df )
    return tuned_ML_R_param_df
[14]:
Rmin = np.round(HD3651B_BD_literature_info['bd_radius_Rjup'],1)- 0.4
Rmax = np.round(HD3651B_BD_literature_info['bd_radius_Rjup'],1)+ 0.4
dR = 0.05
Radius_list = list( np.linspace(Rmin, Rmax, num=int((Rmax - Rmin) / dR) + 1).round(2) )

HD3651B_tuned_ML_R_param_df = tune_radius(
                        Rmin = Rmin,
                        Rmax = Rmax,
                        dR = dR,
                        Radius_list = Radius_list,
                        brown_dwarf_literature_info = HD3651B_BD_literature_info,
                        __plot_results__=True,
                        __print_results__=True,
                        __plot_stat_results__=True,)
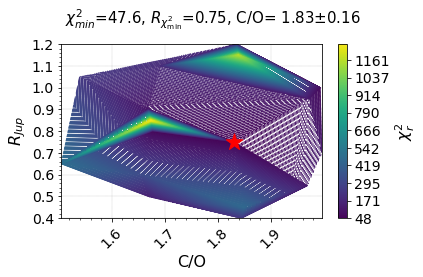
Radius = 0.40 R_Jup:  𝛘2 = 233.95
Radius = 0.45 R_Jup:  𝛘2 = 462.9
Radius = 0.50 R_Jup:  𝛘2 = 149.79
Radius = 0.55 R_Jup:  𝛘2 = 125.62
Radius = 0.60 R_Jup:  𝛘2 = 325.78
Radius = 0.65 R_Jup:  𝛘2 = 491.99
Radius = 0.70 R_Jup:  𝛘2 = 132.82
Radius = 0.75 R_Jup:  𝛘2 = 47.57
Radius = 0.80 R_Jup:  𝛘2 = 64.81
Radius = 0.85 R_Jup:  𝛘2 = 1272.55
Radius = 0.90 R_Jup:  𝛘2 = 109.71
Radius = 0.95 R_Jup:  𝛘2 = 116.17
Radius = 1.00 R_Jup:  𝛘2 = 71.94
Radius = 1.05 R_Jup:  𝛘2 = 248.29
Radius = 1.10 R_Jup:  𝛘2 = 188.0
Radius = 1.15 R_Jup:  𝛘2 = 1147.82
Radius = 1.20 R_Jup:  𝛘2 = 162.3
| radius | chi_square | p_value | gravity | temperature | c_o_ratio | metallicity | |
|---|---|---|---|---|---|---|---|
| 0 | 0.40 | 233.95 | 3.480000e-12 | 4.832331 | 939.179952 | 1.844077 | -0.496821 |
| 1 | 0.45 | 462.90 | 0.000000e+00 | 4.811266 | 922.739583 | 1.849303 | -0.498157 |
| 2 | 0.50 | 149.79 | 1.800000e-03 | 4.880020 | 819.549459 | 1.668540 | -0.505631 |
| 3 | 0.55 | 125.62 | 6.440000e-02 | 4.846250 | 842.642721 | 1.969105 | -0.490685 |
| 4 | 0.60 | 325.78 | 0.000000e+00 | 4.804486 | 813.877848 | 1.656236 | -0.506692 |
| 5 | 0.65 | 491.99 | 0.000000e+00 | 4.832886 | 838.454285 | 1.504140 | -0.517309 |
| 6 | 0.70 | 132.82 | 2.550000e-02 | 5.058064 | 820.930705 | 1.996487 | -0.499381 |
| 7 | 0.75 | 47.57 | 1.000000e+00 | 4.895970 | 826.132629 | 1.830504 | -0.501059 |
| 8 | 0.80 | 64.81 | 9.990000e-01 | 4.918961 | 786.070780 | 1.676969 | -0.506588 |
| 9 | 0.85 | 1272.55 | 0.000000e+00 | 4.771404 | 725.695394 | 1.673388 | -0.511144 |
| 10 | 0.90 | 109.71 | 3.070000e-01 | 4.783756 | 757.061584 | 1.668208 | -0.510398 |
| 11 | 0.95 | 116.17 | 1.770000e-01 | 4.964418 | 772.035360 | 1.971809 | -0.494072 |
| 12 | 1.00 | 71.94 | 9.910000e-01 | 4.841524 | 767.811584 | 1.993379 | -0.497459 |
| 13 | 1.05 | 248.29 | 5.180000e-14 | 4.860020 | 753.598653 | 1.538698 | -0.516551 |
| 14 | 1.10 | 188.00 | 6.420000e-07 | 4.807830 | 735.574585 | 1.692117 | -0.510108 |
| 15 | 1.15 | 1147.82 | 0.000000e+00 | 4.845038 | 733.996704 | 1.838648 | -0.506454 |
| 16 | 1.20 | 162.30 | 1.750000e-04 | 4.899932 | 782.529521 | 1.834756 | -0.504589 |
Summary of Key Statistics Provided by .describe()
Count: The number of non-null entries.
Mean: The average of the data.
Standard Deviation (std): Measures the dispersion of the data from the mean.
Minimum (min): The smallest value in the dataset.
25% (First Quartile): The median of the lower half of the dataset (25th percentile).
50% (Median): The middle value of the dataset (50th percentile).
75% (Third Quartile): The median of the upper half of the dataset (75th percentile).
Maximum (max): The largest value in the dataset.
[15]:
HD3651B_tuned_ML_R_param_df.describe()
[15]:
| radius | chi_square | p_value | gravity | temperature | c_o_ratio | metallicity | |
|---|---|---|---|---|---|---|---|
| count | 17.000000 | 17.000000 | 17.000000 | 17.000000 | 17.000000 | 17.000000 | 17.000000 |
| mean | 0.800000 | 314.824118 | 0.209757 | 4.862009 | 802.228315 | 1.776845 | -0.504300 |
| std | 0.252488 | 361.030674 | 0.384260 | 0.071119 | 61.077289 | 0.155512 | 0.007582 |
| min | 0.400000 | 47.570000 | 0.000000 | 4.771404 | 725.695394 | 1.504140 | -0.517309 |
| 25% | 0.600000 | 116.170000 | 0.000000 | 4.811266 | 757.061584 | 1.668540 | -0.510108 |
| 50% | 0.800000 | 162.300000 | 0.000175 | 4.845038 | 786.070780 | 1.830504 | -0.505631 |
| 75% | 1.000000 | 325.780000 | 0.177000 | 4.895970 | 826.132629 | 1.849303 | -0.498157 |
| max | 1.200000 | 1272.550000 | 1.000000 | 5.058064 | 939.179952 | 1.996487 | -0.490685 |
[16]:
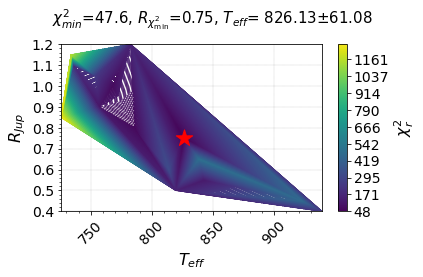
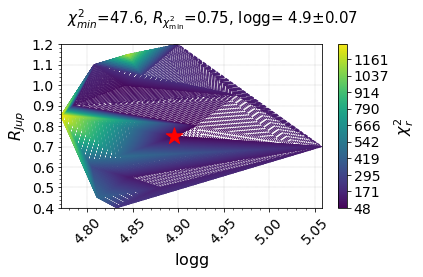
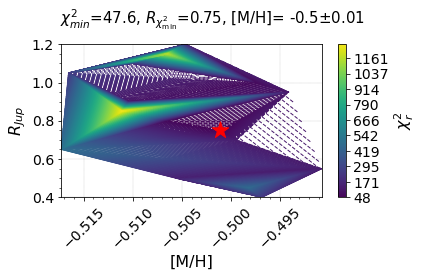
plot_tricontour_chi2_radius(tuned_ML_R_param_df = HD3651B_tuned_ML_R_param_df,
                            literature_info = HD3651B_BD_literature_info,
                                list_=['temperature', 'gravity', 'metallicity', 'c_o_ratio'],
                                __reference_data__ = __reference_data_path__,
                                __save_plot__=True)
[17]:
R_tuned = HD3651B_tuned_ML_R_param_df[ HD3651B_tuned_ML_R_param_df['chi_square'] == min(HD3651B_tuned_ML_R_param_df['chi_square']) ]['radius']
print (f'Tuned R = {float(R_tuned)} R_Jup')
Tuned R = 0.75 R_Jup
2.2.1 Load the data and process
Define the literature data reported for this object
This data will be used later to: - Compare the Literature vs ML predicted results - Convert the unit of the real observational dataset or fluxes from \(F_\lambda\) to \(F_\nu\) and \(F_\nu^{TOA}\) - Revised the object radius
Note: These literature data were taken from Zhang et al. (2021) “Uniform Forward-modeling Analysis of Ultracool Dwarfs. I. Methodology and Benchmarking” link
[18]:
HD3651B_BD_literature_info = {
          'bd_name':'HD3651B',
          'bd_Teff':818,
          'bd_logg':3.94,
          'bd_met': -0.22,
          'bd_distance_pc' : 11.134,
          'bd_radius_Rjup' : float(R_tuned),
          'bd_radius_Rjup_tuned': .81} #0.81

brown_dwarf_literature_info = HD3651B_BD_literature_info
Instintiate the ObserveParameterPredictor class from Predictor module
ObserveParameterPredictor class performs the following tasks: - Load the observational datasets - Process the data including converting their units - Visualize the data
[19]:
# brown_dwarf_literature_info
predict = ObserveParameterPredictor(
                                object_name = HD3651B_BD_literature_info['bd_name'], #e.g., HD3651B
                                training_dataset_df = train_BD,
                                wl_synthetic = wl_synthetic,
                                bd_literature_dic = HD3651B_BD_literature_info,
                                trained_ML_model = trained_CNN_model,
                                trained_X_ColWise_MinMax=trained_StandardScaler_X_ColWise_MinMax,
                                trained_y_ColWise=trained_StandardScaler_y_ColWise,
                                trained_X_RowWise=None,
                                )
Load the observational Telescope data
[20]:
predict.load_observational_spectra(
    __plot_observational_spectra_errorbar__=True,
    __replace_zeros_negatives_with_mean__=True,
    __print_results__=True,
    )
------- Observational DataFrame Example ---------
         wl      F_lambda  F_lambda_error  F_lambda_obs  F_lambda_obs_err
0  0.650857  8.606238e-17    4.358173e-17  8.606238e-17      4.358173e-17
1  0.653073  1.771977e-17    3.360256e-17  1.771977e-17      3.360256e-17
2  0.655278  7.300979e-17    3.132892e-17  7.300979e-17      3.132892e-17
3  0.657472  2.569511e-17    2.837585e-17  2.569511e-17      2.837585e-17
4  0.659659  3.786160e-18    2.497690e-17  3.786160e-18      2.497690e-17
2.2.2 Process the observational Telescope data
[21]:
predict.Process_Observational_Dataset(
    __print_results__=False,
    F_lambda_obs=None,
    F_lambda_obs_err=None    )
[22]:
predict.obs_data_df.columns
[22]:
Index(['wl', 'F_lambda', 'F_lambda_error', 'F_lambda_obs', 'F_lambda_obs_err',
       'Fnu_obs', 'Fnu_obs_err', 'Fnu_obs_TOA', 'Fnu_obs_TOA_err'],
      dtype='object')
Check the processed Telescope dataset
This dataframe includes the following columns:
wl (wavelengths in :math:`mu m`): Wavelengths from the observational dataset.
F_lambda (:math:`F_lambda`): Original observational spectral density flux along the wavelength axis.
F_lambda_error (:math:`F_lambda^{error}`): Original observational spectral density flux uncertainty along the wavelength axis.
F_lambda_obs (:math:`F_lambda^{obs}`): Same as the original F_lambda but with a more descriptive label.
F_lambda_obs_err (:math:`F_lambda^{error, obs}`): Same as the original F_lambda_error but with a more descriptive label.
Fnu_obs (:math:`F_nu^{obs}`): Observational spectral density flux along the frequency axis (converted from the F_lambda column).
Fnu_obs_err (:math:`F_nu^{error}`): Observational spectral density flux uncertainty along the frequency axis (converted from the F_lambda column).
Fnu_obs_TOA (:math:`F_nu^{obs, abs}`): Observational TOA spectral density flux along the frequency axis (converted from the F_lambda column).
Fnu_obs_TOA_err (:math:`F_nu^{obs, abs, error}`): Observational TOA spectral density flux uncertainty along the frequency axis (converted from the F_lambda column).
[23]:
predict.obs_data_df.head(6)
[23]:
| wl | F_lambda | F_lambda_error | F_lambda_obs | F_lambda_obs_err | Fnu_obs | Fnu_obs_err | Fnu_obs_TOA | Fnu_obs_TOA_err | |
|---|---|---|---|---|---|---|---|---|---|
| 0 | 0.650857 | 8.606238e-17 | 4.358173e-17 | 8.606238e-17 | 4.358173e-17 | 1.216085e-27 | 6.158216e-28 | 4.992636e-08 | 2.528256e-08 |
| 1 | 0.653073 | 1.771977e-17 | 3.360256e-17 | 1.771977e-17 | 3.360256e-17 | 2.520930e-28 | 4.780520e-28 | 1.034968e-08 | 1.962643e-08 |
| 2 | 0.655278 | 7.300979e-17 | 3.132892e-17 | 7.300979e-17 | 3.132892e-17 | 1.045711e-27 | 4.487205e-28 | 4.293166e-08 | 1.842222e-08 |
| 3 | 0.657472 | 2.569511e-17 | 2.837585e-17 | 2.569511e-17 | 2.837585e-17 | 3.704967e-28 | 4.091501e-28 | 1.521074e-08 | 1.679766e-08 |
| 4 | 0.659659 | 3.786160e-18 | 2.497690e-17 | 3.786160e-18 | 2.497690e-17 | 5.495628e-29 | 3.625408e-28 | 2.256230e-09 | 1.488411e-08 |
| 5 | 0.661837 | 1.798661e-17 | 2.475434e-17 | 1.798661e-17 | 2.475434e-17 | 2.628032e-28 | 3.616868e-28 | 1.078939e-08 | 1.484905e-08 |
2.2.3 Deploy the Trained ML Models for Prediction:
predict_from_random_spectra function from Predictor class to perform the following tasks:
Generate random spectra based on the observational data
Deploy the trained ML models to predict the target outputs:
gravity ( log\(g\) )
temperature ( T\(_{eff}\) )
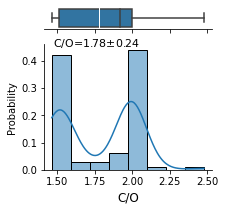
carbon-to-oxygen ratio ( C/O )
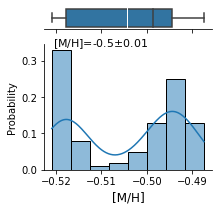
metallicity ( [M/H] )
Print the results, including:
Predicted Targets from Randomly Generated Spectra.
Print a summary of descriptive statistics, including the mean, standard deviation, and the shape of a dataset’s distribution (percentiles).
Visualize the results to gain insights about:
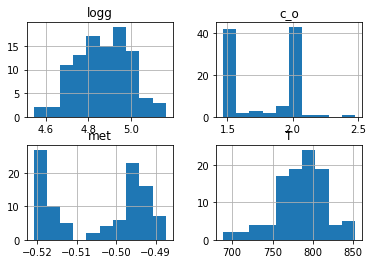
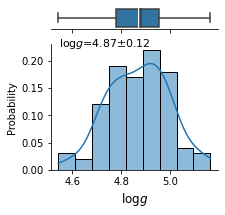
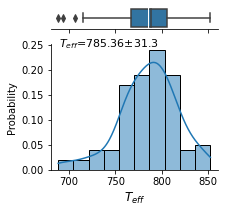
Histograms representing the distribution of the predicted target outputs by the trained ML models.
Boxplots displaying the first quartile, median, third quartile, and maximum. In a box plot, the box is drawn from the first quartile to the third quartile. A vertical black line goes through the box at the median, and a vertical white line goes through the box to indicate the mean.
[24]:
predict.predict_from_random_spectra(random_spectra_num= 100,
                                     __print_results__= True,
                                     __plot_randomly_generated_spectra__= True,
                                     __plot_histogram__= True,
                                     __plot_boxplot_hist__= True,
                                     __plot_pred_vs_obs_errorbar__= False,
                                     __plot_pred_vs_obs_errorbar_stat_bokeh__ = True,
                                     __plot_pred_vs_obs_errorbar_stat_matplotlib__ = False,
                                     __calculate_confidence_intervals_std_df__ = True,
                                    __reference_data__ = __reference_data_path__,
                                     __save_plots__=True,
                                    )
******************************

Predicted Targets from Randomly Generated Spectra:

{   'c_o_ratio': 1.7809257876873017,
    'gravity': 4.870557603836059,
    'metallicity': -0.5044792065024376,
    'temperature': 785.3640881347657}
******************************

             logg         c_o         met           T
count  100.000000  100.000000  100.000000  100.000000
mean     4.870558    1.780926   -0.504479  785.364088
std      0.125511    0.245625    0.011732   31.458470
min      4.541343    1.464361   -0.520945  688.303528
25%      4.779088    1.513868   -0.517756  767.335754
50%      4.879957    1.915469   -0.498695  788.979462
75%      4.954525    1.997715   -0.494482  805.942841
max      5.165425    2.478036   -0.487412  852.542969
<Figure size 432x288 with 0 Axes>
Radius = 0.75 R_Jup: 𝛘2 = 82.9, p-value = 9.27e-01