3. Process Brown Dwarf Atmospheric Parameters
In the following steps, you will:
Load the brown dwarf dataset used to train the ML models.
Prepare the X and y variables to deploy the trained ML models.
Visualize them for a few cases.
We will need the following modules from TelescopeML:
DataMaster: to prepare the synthetic brown dwarf dataset and load the trained machine learning (ML) models.
StatVisAnalyzer: to provide statistical tests and plotting functions.
IO_utils: to provide functions to load the trained ML models.
[1]:
from TelescopeML.DataMaster import *
from TelescopeML.Predictor import *
from TelescopeML.StatVisAnalyzer import *
No Bottleneck unit testing available.

2.1 Load the Synthetic spectra - training dataset
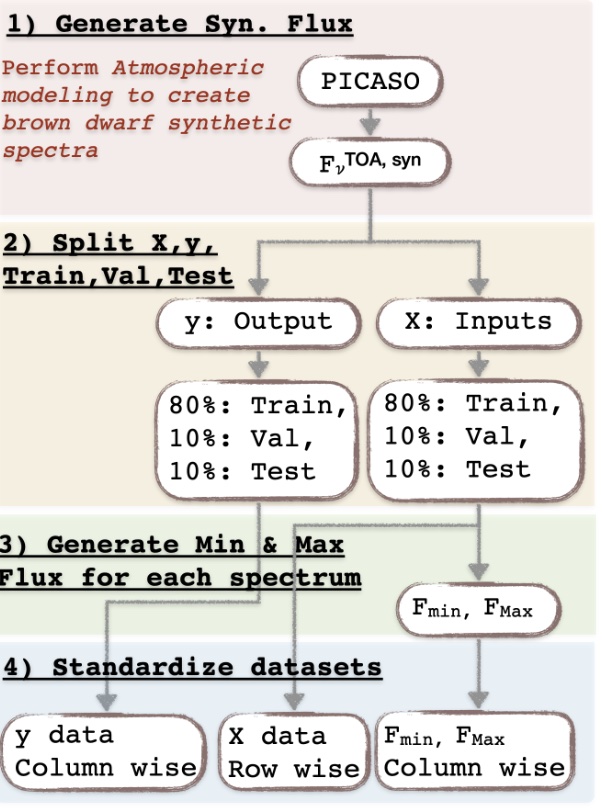
We computed a low-resolution spectrum (\(R\)=200) utilizing atmopshric brown dwarfs grid model, Sonora-Bobcat for spectral range $:nbsphinx-math:sim`$0.9-2.4 :math:mu m`. An open-source atmospheric radiative transfer Python package, PICASO was employed for generating these datasets. This dataset encompass 30,888 synthetic spectra (or instances or rows).
Each spectrum has 104 wavelengths (i.e., 0.897, 0.906, …, 2.512 μm) and 4 output atmospheric parameters:
gravity (log g)
temperature (Teff)
carbon-to-oxygen ratio (C/O)
metallicity ([M/H])
[2]:
import os

__reference_data_path__ = os.getenv("TelescopeML_reference_data")
__reference_data_path__


# Note: insert the directory of the reference_data if you get an error reading the reference data!!!
# __reference_data_path__ = 'INSERT_DIRECTORY_OF_reference_data'
[2]:
'/Users/egharibn/RESEARCH/ml/projects/TelescopeML_project/reference_data/'
Load the dataset and check few instances
[3]:
train_BD = pd.read_csv(os.path.join(__reference_data_path__,
                                    'training_datasets',
                                    'browndwarf_R100_v4_newWL_v3.csv.bz2'), compression='bz2')
train_BD.head(5)
[3]:
| gravity | temperature | c_o_ratio | metallicity | 2.512 | 2.487 | 2.462 | 2.438 | 2.413 | 2.389 | ... | 0.981 | 0.971 | 0.962 | 0.952 | 0.943 | 0.933 | 0.924 | 0.915 | 0.906 | 0.897 | |
|---|---|---|---|---|---|---|---|---|---|---|---|---|---|---|---|---|---|---|---|---|---|
| 0 | 5.0 | 1100 | 0.25 | -1.0 | 9.103045e-08 | 1.181658e-07 | 1.307868e-07 | 1.269229e-07 | 1.159179e-07 | 8.925110e-08 | ... | 1.257751e-07 | 9.640859e-08 | 7.612550e-08 | 6.901364e-08 | 6.247359e-08 | 4.112384e-08 | 5.127995e-08 | 4.897355e-08 | 4.087795e-08 | 2.791689e-08 |
| 1 | 5.0 | 1100 | 0.25 | -0.7 | 9.103045e-08 | 1.181658e-07 | 1.307868e-07 | 1.269229e-07 | 1.159179e-07 | 8.925110e-08 | ... | 1.257751e-07 | 9.640859e-08 | 7.612550e-08 | 6.901364e-08 | 6.247359e-08 | 4.112384e-08 | 5.127995e-08 | 4.897355e-08 | 4.087795e-08 | 2.791689e-08 |
| 2 | 5.0 | 1100 | 0.25 | -0.5 | 9.103045e-08 | 1.181658e-07 | 1.307868e-07 | 1.269229e-07 | 1.159179e-07 | 8.925110e-08 | ... | 1.257751e-07 | 9.640859e-08 | 7.612550e-08 | 6.901364e-08 | 6.247359e-08 | 4.112384e-08 | 5.127995e-08 | 4.897355e-08 | 4.087795e-08 | 2.791689e-08 |
| 3 | 5.0 | 1100 | 0.25 | -0.3 | 9.103045e-08 | 1.181658e-07 | 1.307868e-07 | 1.269229e-07 | 1.159179e-07 | 8.925110e-08 | ... | 1.257751e-07 | 9.640859e-08 | 7.612550e-08 | 6.901364e-08 | 6.247359e-08 | 4.112384e-08 | 5.127995e-08 | 4.897355e-08 | 4.087795e-08 | 2.791689e-08 |
| 4 | 5.0 | 1100 | 0.25 | 0.0 | 9.103045e-08 | 1.181658e-07 | 1.307868e-07 | 1.269229e-07 | 1.159179e-07 | 8.925110e-08 | ... | 1.257751e-07 | 9.640859e-08 | 7.612550e-08 | 6.901364e-08 | 6.247359e-08 | 4.112384e-08 | 5.127995e-08 | 4.897355e-08 | 4.087795e-08 | 2.791689e-08 |
5 rows × 108 columns
2.1.2 Check atmospheric parameters
gravity (log g)
temperature (Teff)
carbon-to-oxygen ratio (C/O)
metallicity ([M/H])
[4]:
output_names = ['gravity', 'temperature', 'c_o_ratio', 'metallicity']
train_BD[output_names].head()
[4]:
| gravity | temperature | c_o_ratio | metallicity | |
|---|---|---|---|---|
| 0 | 5.0 | 1100 | 0.25 | -1.0 |
| 1 | 5.0 | 1100 | 0.25 | -0.7 |
| 2 | 5.0 | 1100 | 0.25 | -0.5 |
| 3 | 5.0 | 1100 | 0.25 | -0.3 |
| 4 | 5.0 | 1100 | 0.25 | 0.0 |
[5]:
# training_features_labels: they are Wavelengths variables in string format

wavelength_names = [item for item in train_BD.columns.to_list() if item not in output_names]
wavelength_names[:5]
[5]:
['2.512', '2.487', '2.462', '2.438', '2.413']
[6]:
# training_features_wl: they are Wavelengths variables

wavelength_values = [float(item) for item in wavelength_names]
wavelength_values[:10]
[6]:
[2.512, 2.487, 2.462, 2.438, 2.413, 2.389, 2.366, 2.342, 2.319, 2.296]
2.1.3 Prepare Inputs and outputs for ML models (X,y)
X: 104 column variables or fluxes
y: output variables: ‘gravity’, ‘temperature’, ‘c_o_ratio’, ‘metallicity’
[7]:
# Training feature variables
X = train_BD.drop(
    columns=['gravity',
             'temperature',
             'c_o_ratio',
             'metallicity'])


# Target/Output feature variables
y = train_BD[['gravity', 'c_o_ratio', 'metallicity', 'temperature', ]]
log-transform the ‘temperature’ variable toreduce the skewness of the data, making it more symmetric and normal-like for the ML model
[8]:
y.loc[:, 'temperature'] = np.log10(y['temperature'])
[9]:
# check the output variables
y.head()
[9]:
| gravity | c_o_ratio | metallicity | temperature | |
|---|---|---|---|---|
| 0 | 5.0 | 0.25 | -1.0 | 3.041393 |
| 1 | 5.0 | 0.25 | -0.7 | 3.041393 |
| 2 | 5.0 | 0.25 | -0.5 | 3.041393 |
| 3 | 5.0 | 0.25 | -0.3 | 3.041393 |
| 4 | 5.0 | 0.25 | 0.0 | 3.041393 |
2.2 Processing the Data
Here we instintiate BuildRegressorCNN class from DeepBuilder module to prepare the datasets and take the trained CNN (Convolutional Neural Networks) for us:
Take the synthetic spectra
Process them, e.g.
Divide them to three sets: train, validation, and test sets
Scale y variables
Scale X variables
Create new features
2.2.1 Instintiate DataProcessor class from DeepBuilder module
[10]:
data_processor = DataProcessor(
                             flux_values=X.to_numpy(),
                             wavelength_names=X.columns,
                             wavelength_values=wavelength_values,
                             output_values=y.to_numpy(),
                             output_names=output_names,
                             spectral_resolution=200,
                             trained_ML_model=None,
                             trained_ML_model_name='CNN',
                                )
2.2.2 Split the dataset into train, validate and test sets
[11]:
data_processor.split_train_validation_test(test_size=0.1,
                                             val_size=0.1,
                                             random_state_=42,)
2.2.3 Standardize X Variables Row-wise
[12]:
# Scale the X features using MinMax Scaler
data_processor.standardize_X_row_wise(output_indicator='Trained_StandardScaler_X_RowWise')
[13]:
plot_boxplot(
            data = data_processor.X_train_standardized_rowwise[:, ::-1],
            title='Scaled main 104 Features',
            xlabel='Wavelength [$\mu$m]',
            ylabel='Scaled Values',
            xticks_list=wavelength_names[::-1],
            fig_size=(18, 5),
            saved_file_name = 'Scaled_input_fluxes',
            __reference_data__ = __reference_data_path__,
            __save_plots__=True
    )

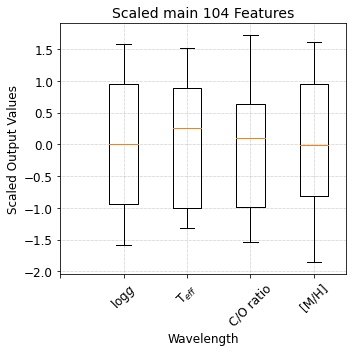
2.2.4 Standardize y Variables Column-wise
[14]:
# Standardize the y features using Standard Scaler
data_processor.standardize_y_column_wise(output_indicator='Trained_StandardScaler_y_ColWise')
[15]:
plot_boxplot(
            data = data_processor.y_train_standardized_columnwise,
            title='Scaled main 104 Features',
            xlabel='Wavelength',
            ylabel='Scaled Output Values',
            xticks_list=['','$\log g$', 'T$_{eff}$', 'C/O ratio', '[M/H]'],
            fig_size=(5, 5),
            saved_file_name = 'Scaled_output_parameters',
            __reference_data__ = __reference_data_path__,
            __save_plots__=True
        )

2.2.5 Feature engeenering: Take Min and Max of each row (BD spectra)
[16]:
# train
data_processor.X_train_min = data_processor.X_train.min(axis=1)
data_processor.X_train_max = data_processor.X_train.max(axis=1)

# validation
data_processor.X_val_min = data_processor.X_val.min(axis=1)
data_processor.X_val_max = data_processor.X_val.max(axis=1)

# test
data_processor.X_test_min = data_processor.X_test.min(axis=1)
data_processor.X_test_max = data_processor.X_test.max(axis=1)
[17]:
df_MinMax_train = pd.DataFrame((data_processor.X_train_min, data_processor.X_train_max)).T
df_MinMax_val = pd.DataFrame((data_processor.X_val_min, data_processor.X_val_max)).T
df_MinMax_test = pd.DataFrame((data_processor.X_test_min, data_processor.X_test_max)).T
[18]:
df_MinMax_train.rename(columns={0:'min', 1:'max'}, inplace=True)
df_MinMax_val.rename(columns={0:'min', 1:'max'}, inplace=True)
df_MinMax_test.rename(columns={0:'min', 1:'max'}, inplace=True)
[19]:
df_MinMax_train.head()
[19]:
| min | max | |
|---|---|---|
| 0 | 8.265340e-12 | 3.445259e-08 |
| 1 | 8.080712e-22 | 8.397132e-14 |
| 2 | 2.734403e-07 | 8.632182e-06 |
| 3 | 4.414951e-16 | 3.373262e-10 |
| 4 | 3.722576e-07 | 6.859888e-06 |
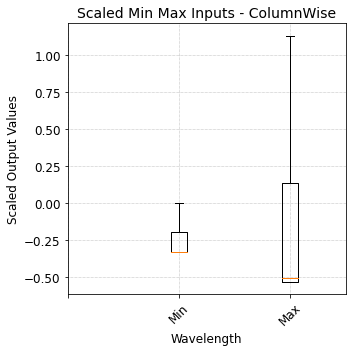
2.2.6 Scale Min Max features - ColumnWise
[20]:
data_processor.standardize_X_column_wise(
                                        output_indicator='Trained_StandardScaler_X_ColWise_MinMax',
                                        X_train = df_MinMax_train.to_numpy(),
                                        X_val   = df_MinMax_val.to_numpy(),
                                        X_test  = df_MinMax_test.to_numpy(),
                                        )
[21]:
plot_boxplot(
            data = data_processor.X_test_standardized_columnwise,
            title='Scaled Min Max Inputs - ColumnWise',
            xlabel='Wavelength',
            ylabel='Scaled Output Values',
            xticks_list= ['','Min','Max'],
            fig_size=(5, 5),
            saved_file_name = 'Scaled_input_Min_Max_fluxes',
            __reference_data__ = __reference_data_path__,
            __save_plots__=True
            )
